
Background & Blog Contributors


Dev Shukla and I had worked together on a lightning venture for a couple of months and We decided to start a blog series to share our learning and experiments with “Lightning Lovers”.Many thanks to Dev Shukla for his contributor to this blog series.You can connect with Dev at twitter and check more about him here.
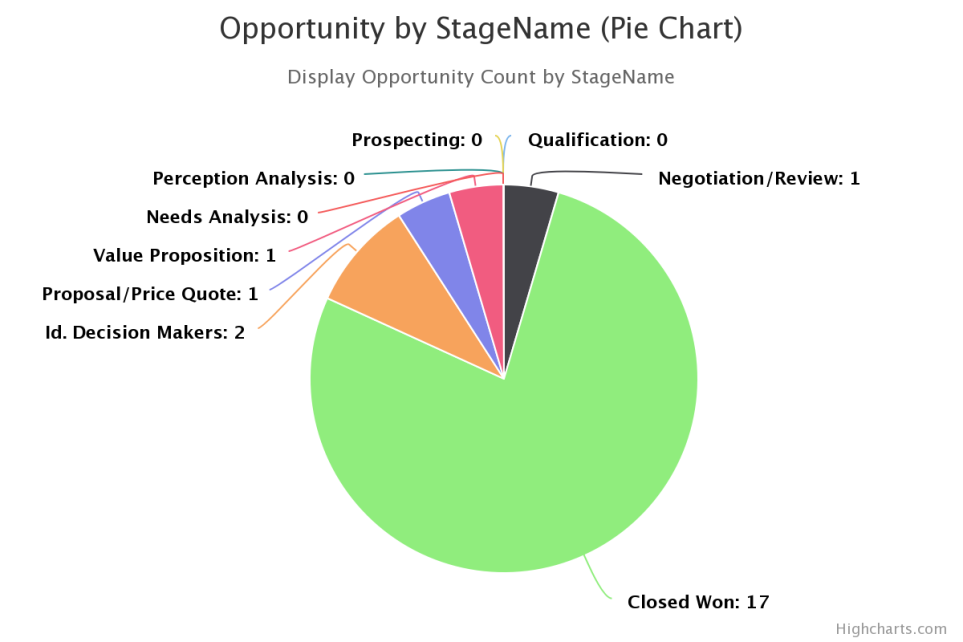
Generating Charts Using Lightning Components
In general we can use standard Report chart component provided by Salesforce and using app builder we can add into Lightning layouts but for complex business use case we have to develop the custom component for the same in Lightning. For example if Sales users wants to print or download the chart in Lightning and wants to share with other team users so using standard chart component you can’t export the chart.
Here is the working demo: Live Demo
Here some of highlights of this component.
I have used HIGHCHARTS library.
1. Download the javascript from here: DOWNLOAD
2. Upload this JS file into a static resource named as “Highcharts”.
Details of this Dynamic Chart lightning component:
1. This component is used to display graphical representation of data.
2. The component is fully dynamic means it can be used for different types of graphs/charts and different data.
3. There are 6 attributes in this component.
- ChartType: It determines the type of chart. For eg: column, bar etc.
- ChartTitle: The title of the chart
- chartSubTitle: The subtitle of the chart
- xAxisCategories: The X-Axis parameters in the graph. It is an array of string.
- yAxisParameter: The Y-Axis parameter in the graph.
- data: It accepts JSON format of an array of object.
Here you go step by step Instructions to create the Lightning Chart component.
-
Apex Controller
public class LinechartController {
@AuraEnabled
    public static String getOpportunityJSON(){

       List<opportunity> lstopp = [SELECT Id, stagename FROM opportunity ];
        Map<String,Integer> mapLeadSource = new Map<String,Integer>();

        for(opportunity l : lstopp)
        {
            if(mapLeadSource.containsKey(l.stagename))
            {
                mapLeadSource.put(l.stagename, mapLeadSource.get(l.stagename)+1) ;
            }else{
                mapLeadSource.put(l.stagename, 0) ;
            }
        }
        system.debug('map values--'+mapLeadSource);
        list<RadarDataWrapper> radarData = new list<RadarDataWrapper>();

        for(String key : mapLeadSource.keySet())
        {
           RadarDataWrapper rdw = new RadarDataWrapper();
            rdw.name=key;
            rdw.y=mapLeadSource.get(key);
            radarData.add(rdw);
        }
        system.debug('rdw---'+radarData);
        return System.json.serialize(radarData);
        //return null;
    }

    /**
     * Wrapper class to serialize as JSON as return Value
     * */
    class RadarDataWrapper
    {
       @AuraEnabled
       public String name;
       @AuraEnabled
       public integer y;

    }

}
2. Lightning Component code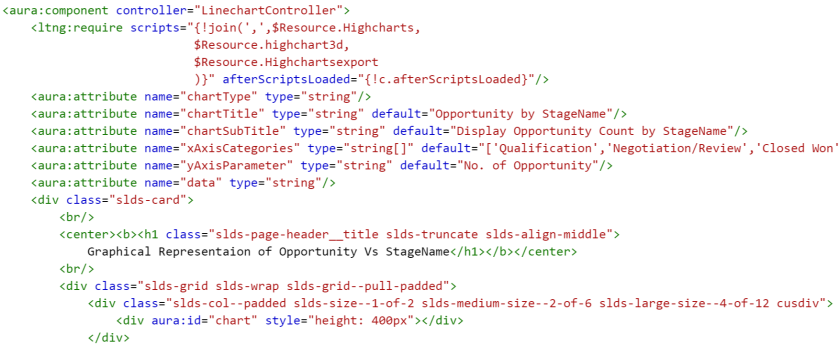 You can take complete component code here
3.Lightning Component JS Controller Code
({
    afterScriptsLoaded : function(component, event, helper)
    {
        helper.doInit(component,event,helper);
    }

})
4. Lightning Component Helper code
({
    doInit : function(component, event, helper)
    {
        var action = component.get("c.getOpportunityJSON");
        action.setCallback(this, function(response) {
            var state = response.getState();
            //alert(state);
            if (state === "SUCCESS") {
                var dataObj= response.getReturnValue();
                //jsonData = dataObj;
                console.log('===='+dataObj);
                component.set("v.data",dataObj);
                helper.piechart(component,event,helper);
                helper.Linechart(component,event,helper);
                helper.donutchart(component,event,helper);
            }
        });
        $A.enqueueAction(action);
    },
    piechart : function(component,event,helper) {
        var jsonData = component.get("v.data");
        var dataObj = JSON.parse(jsonData);

        new Highcharts.Chart({
            chart: {
                plotBackgroundColor: null,
                plotBorderWidth: null,
                plotShadow: false,
                renderTo: component.find("chart").getElement(),
                type: 'pie'
            },
            title: {
                text: component.get("v.chartTitle")+' (Pie Chart)'
            },
            subtitle: {
                text: component.get("v.chartSubTitle")
            },
            xAxis: {
                categories: component.get("v.xAxisCategories"),
                crosshair: true
            },
            yAxis: {
                min: 0,
                title:
                {
                    text: component.get("v.yAxisParameter")
                }
            },
            tooltip: {
                pointFormat: '{series.name}: <b>{point.y}</b>'
            },
            plotOptions: {
                pie: {
                    allowPointSelect: true,
                    cursor: 'pointer',
                    dataLabels: {
                        enabled: true,
                        format: '<b>{point.name}</b>: {point.y} ',
                        style: {
                            color: (Highcharts.theme && Highcharts.theme.contrastTextColor) || 'black'
                        }
                    }
                }
            },
            series: [{
                name:'StageName',
                data:dataObj
            }]

        });

    },

    Linechart : function(component,event,helper) {
        var jsonData = component.get("v.data");
        var dataObj = JSON.parse(jsonData);

        new Highcharts.Chart({
            chart: {
                plotBackgroundColor: null,
                plotBorderWidth: null,
                plotShadow: false,
                renderTo: component.find("linechart").getElement(),
                type: 'line'
            },
            title: {
                text: component.get("v.chartTitle")+' (Line Chart)'
            },
            subtitle: {
                text: component.get("v.chartSubTitle")
            },
            xAxis: {
                categories: component.get("v.xAxisCategories"),
                crosshair: true
            },
            yAxis: {
                min: 0,
                title:
                {
                    text: component.get("v.yAxisParameter")
                }
            },
            tooltip: {
                pointFormat: '{series.name}: <b>{point.y}</b>'
            },
            plotOptions: {
                line: {
                    dataLabels: {
                        enabled: true
                    },
                    enableMouseTracking: false
                }
            },
            series: [{
                name:'StageName',
                data:dataObj
            }]

        });

    },
    donutchart : function(component,event,helper) {
        var jsonData = component.get("v.data");
        var dataObj = JSON.parse(jsonData);

        new Highcharts.Chart({
            chart: {
                renderTo: component.find("donutchart").getElement(),
                type: 'pie',
                options3d: {
                    enabled: true,
                    alpha: 45
                }
            },
            title: {
                text: component.get("v.chartTitle")+' (Donut Chart)'
            },
            subtitle: {
                text: component.get("v.chartSubTitle")
            },
            tooltip: {
                pointFormat: '{series.name}: <b>{point.percentage:.1f}%</b>'
            },
            plotOptions: {
                pie: {
                    innerSize: 100,
                    depth: 45
                }
            },
            series: [{
                type: 'pie',
                name:'StageName',
                data:dataObj
            }]

        });

    }
})
Here is Output of Component :
GitHub Repository
You can also download the code from the github repository here.
References :

Hi sir I want to export this chart as an image in my lightning component, I am finding for solution but i was unable to get it. Please help me sir
LikeLike
Hi Sai, You can use the above code and there you will get the option to download the chart.
LikeLike